Regional reader
What is likely where I live?
What this view explainsRegional outlooks are closer to the decision than a global headline.
What it may missA probability is not a guarantee.
The weekly paper
for curious people
See the connections.
Understand the consequences.
Swipe to see more sections →
Issue 006 · Climate · Measurement
The Pacific signal is unusually strong. Its Australian consequences still depend on where you live, which season you mean and what else the climate is doing.
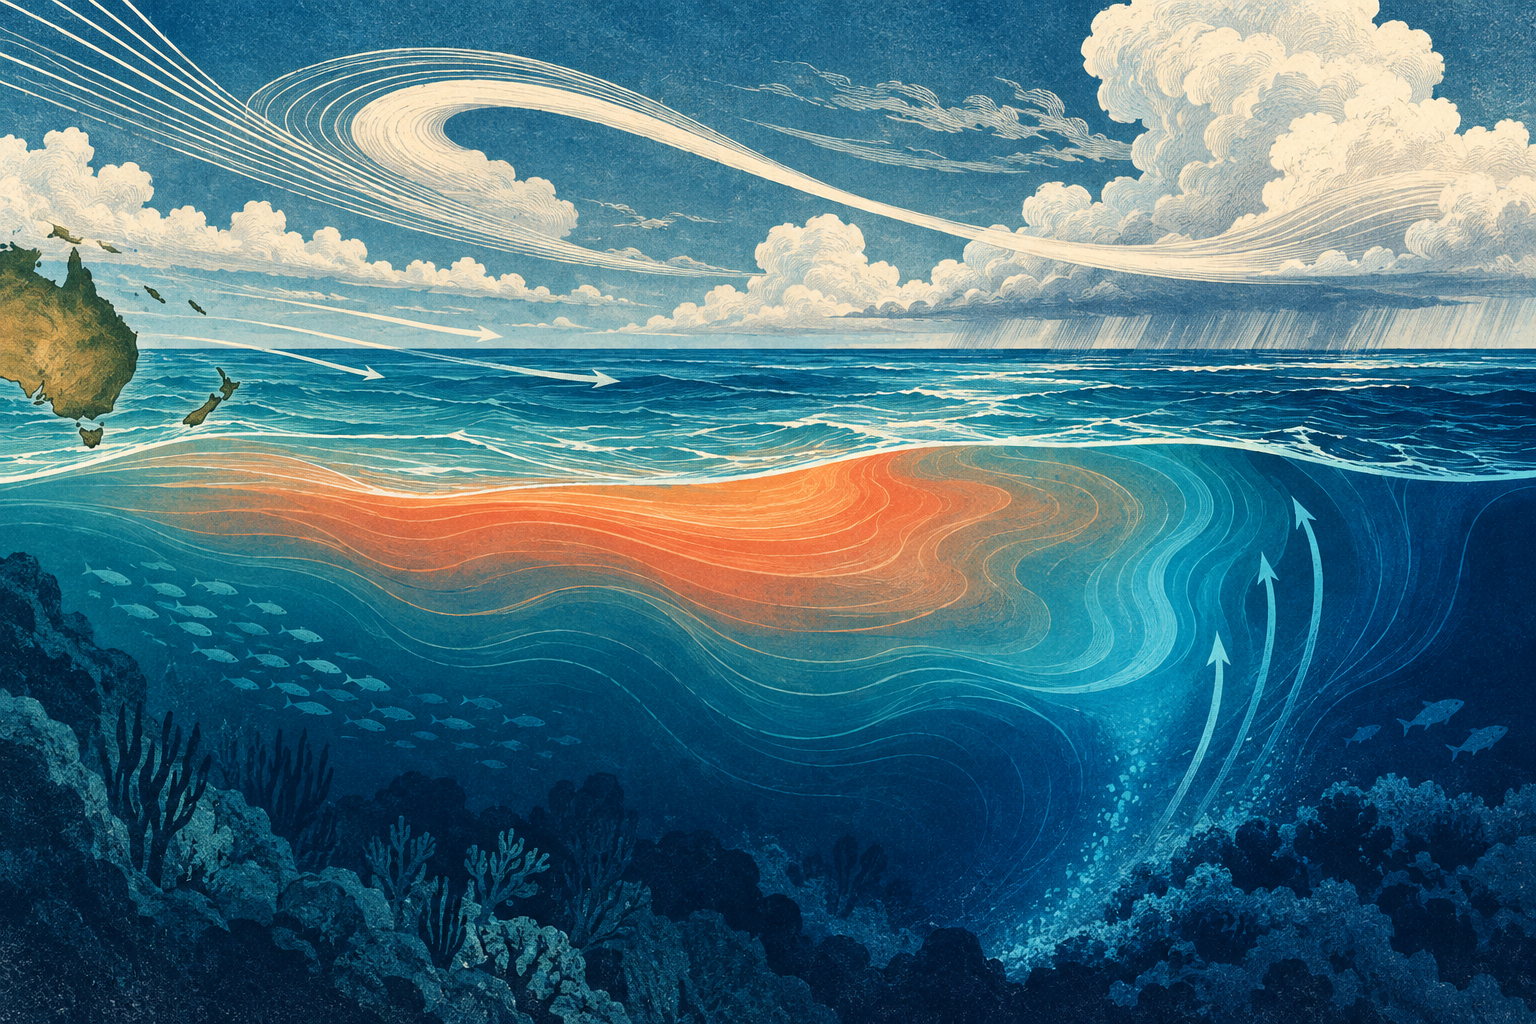
Strong event observed; peak and regional impacts forecast
A possible record Pacific index is a forecast, not an observed peak—and it is not a ranking of Australian summers. The current outlook combines a dry tilt in the southeast with wetter odds across much of the west and centre.
Why Lens says this →Watch through Lens · Issue 006 · 8:37
Start with el niño at 4:25, then follow the rest of the episode. The reporting and sources stay on this page.
Choose how to read this
The facts do not change. Each view uses the same published sources and leaves the same questions open.
See through another Lens
Each view notices something useful. None is allowed to stand in for the complete evidence.
Regional reader
What is likely where I live?
What this view explainsRegional outlooks are closer to the decision than a global headline.
What it may missA probability is not a guarantee.
The record
The Bureau's 15 September update reported a weekly relative Niño3.4 value of +2.51°C for the week ending 13 September. Its models indicated a possible peak above +3°C in late spring or summer, potentially beyond the reliable record beginning in 1950. The first number is an observation; the second describes a possible future.
Niño3.4 measures sea-surface temperature across a defined strip of the central equatorial Pacific. The relative version adjusts the local anomaly for the tropical ocean's broader warming and rescales it. Its reference period is 1991–2020. It is neither the water's actual temperature nor a measure of global warming.
Bureau Southern Hemisphere monitoring ↗Bureau climate-index definitions ↗ECMWF: measuring El Niño strength ↗
See how it works
Relative Niño3.4 index
Possible peak—not yet observed
How it works
Warm water changes where air rises, clouds form and rain falls. Winds also change the ocean beneath them. That reinforcing ocean–atmosphere relationship is what makes ENSO a climate system rather than simply a warm patch on a map.
The September monitoring describes atmospheric responses consistent with El Niño. But the response over Australia also depends on other ocean basins and weather systems. The Pacific number is an influence on the forecast, not a formula for the result.
Bureau Southern Hemisphere monitoring ↗Bureau: El Niño and Australia ↗
The record
For October–December, the outlook issued on 17 September favours wetter-than-average conditions across much of the west and centre and drier conditions in the southeast and parts of the far north. Many eastern and northern areas have no clear rainfall tilt.
The temperature outlook is more broadly warm: above-average daytime temperatures are favoured in most regions, with exceptions in parts of the tropical north; warmer nights are favoured across Australia. Rainfall and temperature are separate forecasts. A wetter outlook does not automatically mean a cool season.
See how it works
Most WA and SA, southern two-thirds of NT, western Queensland and parts of northern NSW: 60% to over 80% chance of above-average rain.
60–80% chance of below-average rain in the favoured areas. This is not a forecast of drought everywhere.
Many areas have roughly equal rainfall chances. October alone has a broader dry signal.
Warmer days favoured in most areas, with some tropical-north exceptions; warmer nights favoured nationally.
How it works
The Indian Ocean Dipole describes the temperature contrast across the tropical Indian Ocean. The Bureau still classified it as neutral in its 15 September monitoring, despite a weekly index above the positive threshold. Sustained conditions matter; crossing a line for one week is not the same as establishing an event.
Shorter-lived circulation changes and the existing state of the land can also alter outcomes. Dry ground, recent rainfall and local vegetation affect how a hot spell is experienced. This article has not assembled current soil-moisture or fuel-condition measurements for each region, so it does not turn the seasonal outlook into a fire-risk map.
Bureau Southern Hemisphere monitoring ↗Bureau: El Niño and Australia ↗Bureau long-range outlook ↗
How it works
ENSO is natural variability. Human-driven warming changes the background on which it operates. Copernicus reported record August sea-surface temperatures for its extra-polar ocean measure in 2026; that is a different region and statistic from the relative Niño3.4 index.
The relative index helps distinguish a regional Pacific pattern from the warming shared by the wider tropics. It does not remove the warmer background from people's actual weather. Nor does it show that climate change caused this particular El Niño. That is a separate attribution question.
Copernicus August 2026 bulletin ↗ECMWF: measuring El Niño strength ↗
Lens analysis
First define “worst”: highest national average temperature, most dangerous local heat, lowest rainfall, greatest fire damage or largest agricultural loss? Those are different outcomes, with different exposure and preparation.
Then compare like with like. A weekly relative index should not be casually ranked against a three-month traditional index from an older chart. And an October–December outlook is not a complete forecast for the December–February summer.
For now, the useful response is regional: follow updates for your area, distinguish heat from rainfall, and keep the observed ocean signal separate from the forecast impacts. An extraordinary measurement can justify attention without supplying a simple answer about the months ahead.
Bureau Southern Hemisphere monitoring ↗Bureau long-range outlook ↗Bureau climate-index definitions ↗
The Bureau's September monitoring raises the possibility of a record relative Niño3.4 peak; the newer regional outlook still shows substantial geographic differences.
A possible record Pacific index is a forecast, not an observed peak—and it is not a ranking of Australian summers. The current outlook combines a dry tilt in the southeast with wetter odds across much of the west and centre.
Bureau monitoring issued 15 September and regional outlook issued 17 September, inspected separately.
A possible record Pacific index is a forecast, not an observed peak—and it is not a ranking of Australian summers. The current outlook combines a dry tilt in the southeast with wetter odds across much of the west and centre.
The outlook favours above-average rainfall across much of western and central Australia despite the strong El Niño. A national dry-summer headline would erase this.
Monitoring to 13 September, issued 15 September; outlook issued 17 September for October–December. Neither is a complete December–February summer forecast.
AI-assisted research and writing. Evidence checked 2026-09-18.
Weekly relative Niño3.4 +2.51°C to 13 September, atmospheric coupling, forecast possible record peak and neutral current IOD.
A1 · Published 2026-09-15 · Checked 2026-09-18Browser inspection of updated 17 September outlook: October–December wet west/centre, dry southeast, widespread warmth. Search cache contains older 10 September text.
A1 · Published 2026-09-17 · Checked 2026-09-181991–2020 reference period and relative index subtracting tropical mean anomaly, with rescaling.
A2 · Published date not stated · Checked 2026-09-18Explains relative vs traditional Niño indices and scaling; avoid direct comparisons across incompatible definitions.
A2 · Published date not stated · Checked 2026-09-18August global warmth and extra-polar SST context; monthly record does not establish the cause of an individual Australian event.
A1 · Published date not stated · Checked 2026-09-18Typical seasonal influences are regional and probabilistic, not deterministic.
A2 · Published date not stated · Checked 2026-09-18Historical events differ in coupling, timing and other drivers; updated relative index history.
A2 · Published date not stated · Checked 2026-09-18Possible effects · We cannot say how likely
It could shift seasonal odds and preparedness priorities, but a possible record Pacific index is neither an observed peak nor a ranking of Australia's summer. Regional outlooks and other climate drivers remain essential.
The Bureau reported strong coupled El Niño conditions, a possible record relative index and a seasonal outlook with differing rainfall odds across Australian regions.
If strong coupling persists, agencies and households could adjust heat, fire, water and agricultural planning using regional outlooks rather than treating one Pacific number as a national outcome.
Where the connection stopsThe records support probabilistic seasonal influence, not a deterministic worst-summer forecast or direct comparison across incompatible indices.
How people may respond
A record climate label can change preparedness and public attention even though it does not determine Australia's local summer outcome.
What the evidence does not showThe global indicators and Australian dependencies are documented; audience response and local impact remain conditional.
Global ocean and atmospheric indicators are presented alongside Australian forecast dependencies.
Institutions may interpret persistent coupling as a reason to prepare for heat, fire or rainfall risks without claiming a fixed outcome.
Attention moves toward updated local forecasts and readiness.
Emergency, climate and land-management agencies: Adjust planning as Australian indicators become clearer.
Preparedness settings may change before impacts are observed.
What we know has changedWe have not established that this possible change has happened.
What this does not showPreparation does not prove that the worst scenario will occur.
This is the first time Lens has mapped this path. We have no later evidence showing whether it is happening more, less or about the same.
A record or El Niño label is prominent and memorable.
Readers may collapse a global classification into certainty about one Australian season.
Attention concentrates on the label while local drivers receive less weight.
Media, households and institutions: Plan or communicate around a deterministic reading of the record.
Expectations can move without the local probability landscape moving by the same amount.
What we know has changedWe have not established that this possible change has happened.
What this does not showA global label alone does not establish Australia's realised weather.
This is the first time Lens has mapped this path. We have no later evidence showing whether it is happening more, less or about the same.
If the observed Pacific event remains strongly coupled and regional outlooks retain elevated heat or dryness in exposed areas
Then preparedness could intensify for region-specific fire, heat, water and agricultural risks without assuming the same result nationwide.
Would weaken this: Coupling weakens or the event decays earlier than forecast. Regional outlooks shift materially as other drivers change.
Scope: Seasonal risk preparation, not prediction of a particular fire, drought or temperature record. Horizon: Successive spring and summer outlook updates.
If the Pacific measure reaches an exceptional level while Australian rainfall and temperature outcomes vary by region
Then the record label could remain scientifically notable without making the season Australia's worst by a single national measure.
Would weaken this: Multiple national and regional outcome measures independently reach comparable extremes. The forecast index does not reach the proposed record.
Scope: The distinction between Pacific index strength and Australian outcomes. Horizon: After the event peak and seasonal observations are available.
Weekly relative Niño3.4 +2.51°C to 13 September, atmospheric coupling, forecast possible record peak and neutral current IOD.
Open evidence ↗Browser inspection of updated 17 September outlook: October–December wet west/centre, dry southeast, widespread warmth. Search cache contains older 10 September text.
Open evidence ↗Explains relative vs traditional Niño indices and scaling; avoid direct comparisons across incompatible definitions.
Open evidence ↗Typical seasonal influences are regional and probabilistic, not deterministic.
Open evidence ↗What could change this assessment?
Free Lens updates
Our free weekly email brings you the latest Lens reporting and what changed.